
DIRECT ANSWER
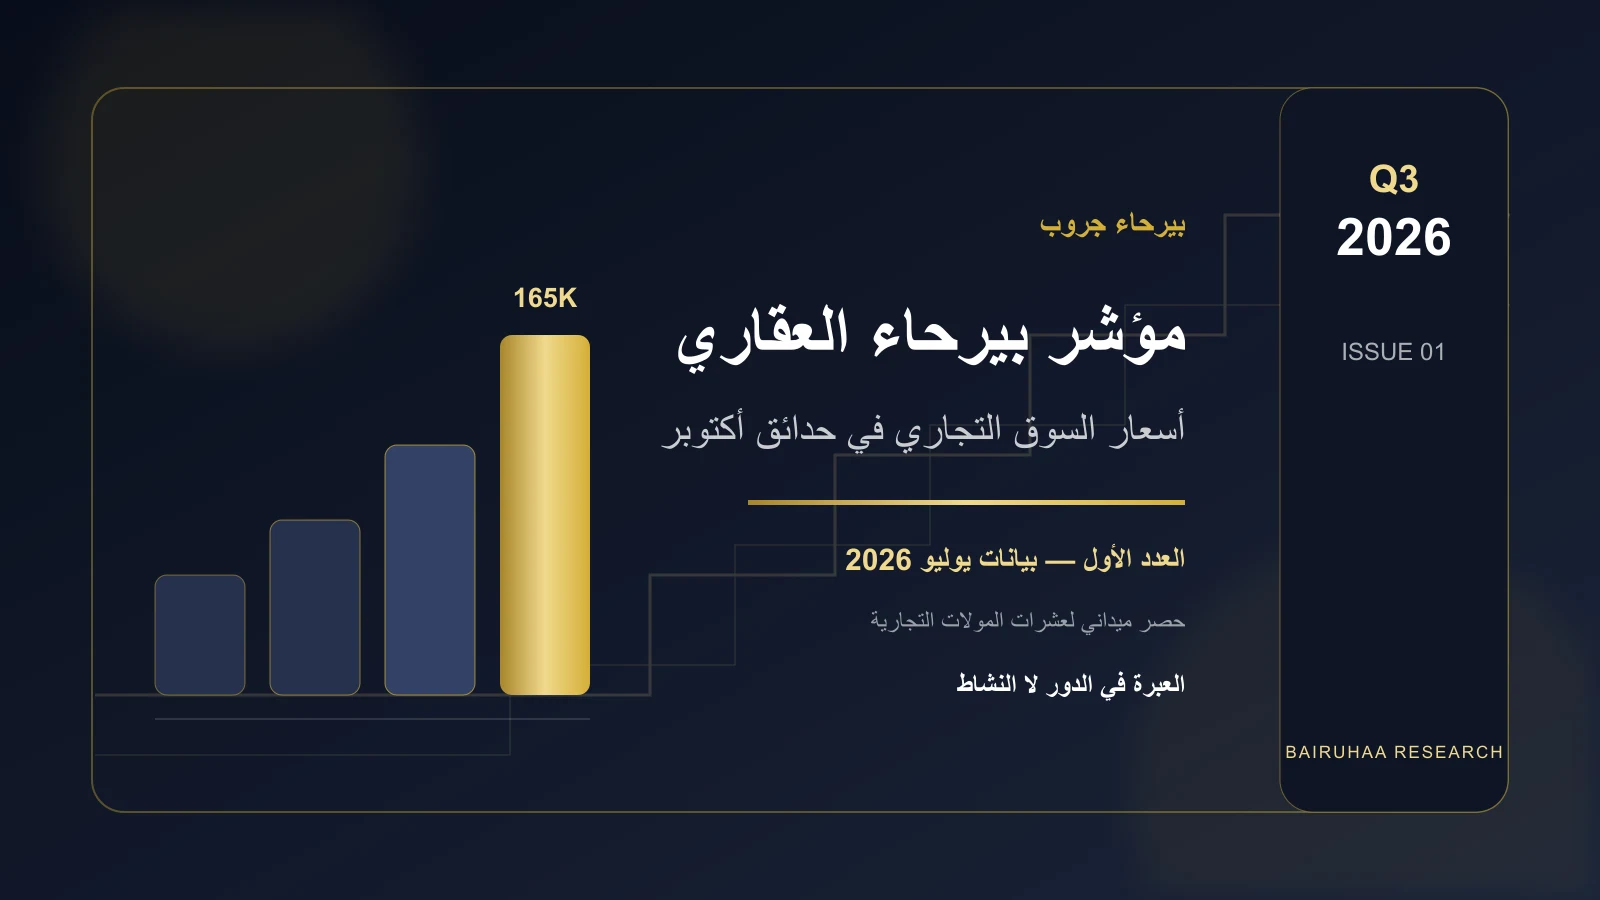
July 2026 issue at a glance
Median ground-floor retail price
within the EGP 120k–200k/m² band
Upper-floor administrative and medical range
Floor level matters more than use label
RATIONALE
Why did Bairuhaa publish this index?
What investors in October Gardens most often lack is not capital, but a reliable reference number. Asking for the commercial price per square metre usually produces scattered listings rather than one consistently measured market view.
While preparing our commercial project, Bairuhaa’s team conducted a field survey of dozens of malls across October Gardens. We chose to publish the findings as a quarterly reading that applies the same criteria to the whole market, including our own project.
This issue follows one governing analytical rule: mall price differences are driven primarily by floor level, not the activity label. A clinic on a higher floor is cheaper because it is higher, not because it is medical; an office on that same floor would carry the same price.
PRIMARY INDICATOR
Price per square metre by floor
Ground floor is the most expensive, followed by a decline with each higher level. Administrative and medical uses on the same floor are priced alike: floor level matters more than use label.
Source: Bairuhaa field survey — July 2026 data.
| Floor | Predominant use | Median price | Relative index |
|---|---|---|---|
| Ground floor | Retail | Approx. EGP 165,000/m² | 100% (reference) |
| First floor | Predominantly retail | Slightly below ground floor | Below reference |
| Second floor and above | Administrative / medical | Approx. EGP 62,500–75,000/m² | Approx. 38%–45% |
Bairuhaa reading: The largest price step-down occurs when moving from retail floors to service floors. Differences within service floors are modest and are explained by floor level.
MARKET DISTRIBUTION
Where do most prices sit?
Source: Bairuhaa field survey — July 2026 data.
| Price band | Classification | Mall share |
|---|---|---|
| Below EGP 120k | Economy | 8% |
| EGP 120k–160k | Mid-market | 38% |
| EGP 160k–200k | Upper mid-market | 46% |
| Above EGP 200k | Premium | 8% |
Reference range: About 84% of malls fall within the EGP 120,000–200,000/m² ground-floor retail band. Any offer outside it deserves a clear question about the discount or premium.
REFERENCE ESTIMATES
Estimated rental yield indicator
Source: July 2026 issue estimates based on prices available at the time of the survey.
| Floor / unit type | Estimated yield range |
|---|---|
| Ground-floor retail | 15%–17% |
| Upper-floor administrative and medical | 18%–19% |
These figures are estimates calculated from expected rents after operation against current selling prices. Yield estimates vary by unit type, floor, purchase price and rental value at the time of operation.
VERIFIABILITY
Bairuhaa Real Estate Index methodology
The Bairuhaa Real Estate Index is an indicative market reading based on asking prices available at the time of the survey. It is not a formal valuation or investment advice.
FAQ
Frequently asked questions about commercial prices
What is the commercial price per square metre in October Gardens in 2026?
Bairuhaa’s field survey of dozens of malls places the median ground-floor retail price at about EGP 165,000/m², with a common range of EGP 131,000–215,000/m². Around 84% of malls fall within the EGP 120,000–200,000/m² band.
Why do prices vary within the same mall?
The primary factor is floor level rather than use type. Ground floor is the most expensive, followed by the predominantly retail first floor, then service floors from the second level upward. Administrative and medical uses on the same floor are priced alike.
Are clinics cheaper than administrative offices?
Not because of use type, but because of floor level. In malls with three-use licensing, medical and administrative units share the second floor at the same price. A difference appears only when each use occupies a separate floor, with the higher floor priced slightly lower.
What estimated rental yield can a commercial unit generate?
The July 2026 issue indicates an estimated reference range of 15%–19% depending on floor level. Yield estimates vary by unit type, floor, purchase price and rental value at the time of operation.
Who prepared the index, and is it neutral?
The Bairuhaa Group Research Department prepared the index through a field survey of dozens of malls. It applies the same criteria to the wider market, including Bairuhaa’s own project, and is an indicative market reading rather than a formal valuation or investment advice.
Use the index as a reference, then test the opportunity in front of you
Download the files, request detailed data or discuss your assumptions with the Bairuhaa team.